
Purchasing Power of the Dollar
Thomas Henriques • September 23, 2025
If there is one consistent theme in the history of paper (or fiat) currency has been the devaluation of it. And it is relentless:
Here is how the purchasing power of the U.S. dollar has changed over the past 10, 20, and 30 years:
Last 10 years (2015–2025)
- $1 in 2015 has the same buying power as $1.36 in 2025.
- A dollar today only buys about 74% of what it could buy in 2015.
- Purchasing power loss: About 26% decline.
Last 20 years (2005–2025)
- $1 in 2005 has the same buying power as $1.65 in 2025.
- A dollar today only buys 61% of what it could in 2005.
- Purchasing power loss: About 39% decline.
Last 30 years (1995–2025)
- $1 in 1995 has the same buying power as $2.12 in 2025.
- A dollar today buys just 47% of what it did in 1995.
- Purchasing power loss: About 53% decline.
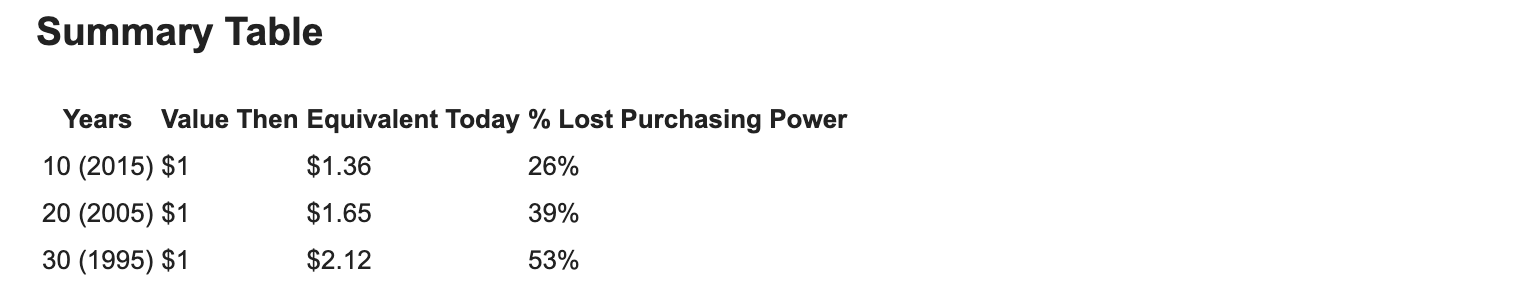
These figures show how inflation has eroded the dollar’s purchasing power substantially across all intervals, with the impact accelerating over three decades. (source perplexity)
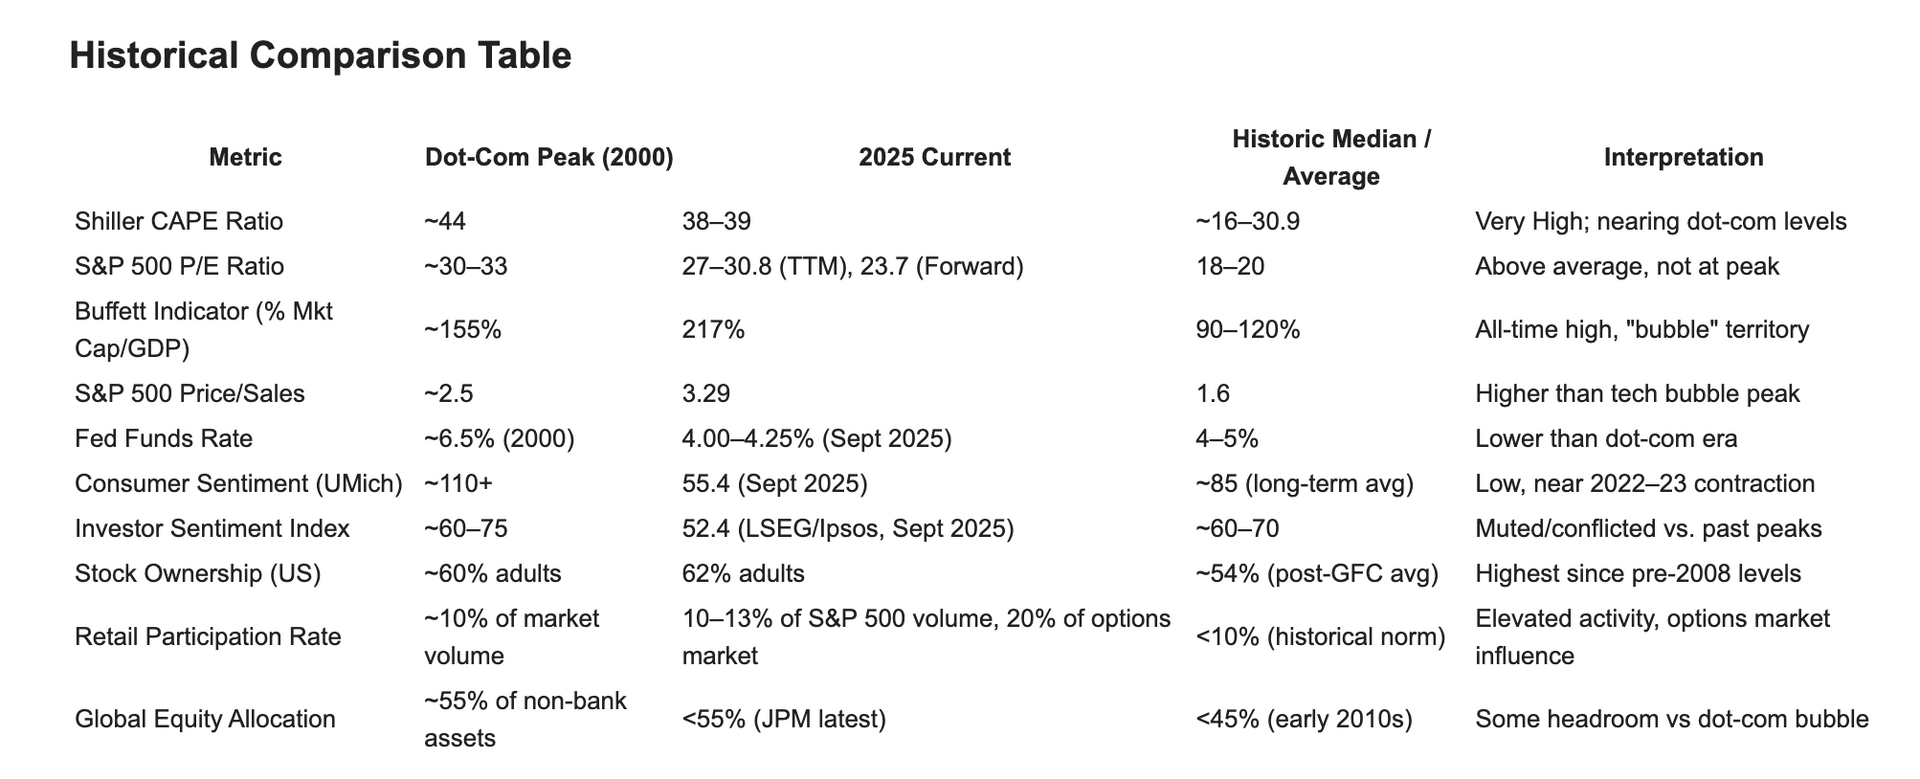
As the S&P 500 continues to scale new highs—up 14% year-to-date and driven mainly by tech and AI darlings—the age-old bull vs. bear debate is reaching fever pitch. Investors and analysts are increasingly referencing historic valuation yardsticks and comparing today’s environment to both the dot-com bubble of 2000 and classic market excesses. Let’s examine the arguments from each camp, using well-cited market valuation data.

Discover how a Multi-Year Guaranteed Annuity (MYGA) earning 5% annually can turn $100,000 into $162,890 in 10 years , with guaranteed growth and no market risk.
what is the historical average valuation of the stock market and where are we today? the buffet indicator, cape ratio and more