Wall Street’s 2025 Tug of War: Are Stocks in Bubble Territory or Justified by Innovation?
As the S&P 500 continues to scale new highs—up 14% year-to-date and driven mainly by tech and AI darlings—the age-old bull vs. bear debate is reaching fever pitch. Investors and analysts are increasingly referencing historic valuation yardsticks and comparing today’s environment to both the dot-com bubble of 2000 and classic market excesses. Let’s examine the arguments from each camp, using well-cited market valuation data.
Bulls: "This Time It's Different":
- Earnings Power & Tech Innovation: Bulls point to robust profit growth among the largest companies (“Magnificent 7”), dominating S&P 500 returns through relentless innovation and sustained high margins. Unlike 2000, they argue, today’s market leaders have proven business models and strong free cash flow.
- Structural Shifts: The digital transformation—AI, cloud, data analytics—justifies a higher baseline for multiples, as these businesses can scale revenue faster and more cost-effectively than their dot-com predecessors.
- Monetary Policy Tailwinds: Lower real rates, stabilizing inflation, and economic resilience are seen as supportive for further asset appreciation, even if gains are more muted than in the past two years.
- Global Leadership: The U.S. remains the world’s “growth engine,” with S&P 500 earnings expected to broaden beyond large tech as AI adoption spreads to other sectors.
Bears: “Echoes of the Dot-Com Bubble”:
- Valuation Multiples Are Extreme: The cyclically-adjusted price/earnings (Shiller CAPE Ratio) has soared above 38, nearly double its long-run median, and approaching levels witnessed just prior to the dot-com crash (CAPE peaked at ~44 in 2000).
- Buffett Indicator Signals ‘Bubble’: Market capitalization to GDP stands at 217%—higher than the 2000 peak and about two standard deviations above the norm, flashing a “strongly overvalued” warning.
- Price-to-Sales Ratio Near Records: The S&P 500 price-to-sales ratio reached 3.29, surpassing the dot-com peak of ~2.5 and far above its historic median of 1.6.
- Market Concentration Risk: Index leadership is narrow—just 10 stocks command over 30% of S&P 500 value, trading at 30x earnings while the rest trade closer to 18x, mirroring the “two-tier” market dynamic of the late 1990s.
- History as a Warning: High valuations, combined with exuberant investor sentiment and concentration in technology/AI, raise the risk of below-average future returns and susceptibility to a sharp correction.
Where Does This Leave Investors?
Both sides of the debate find strong footing in valuation comparisons and market signals. Bulls see a new era powered by genuine earnings and innovation, while bears warn that history rarely rewards sustained excess regardless of short-term earnings momentum.
Ultimately, the verdict may hinge on whether the rest of the market can catch up to its tech leaders, and whether today’s high valuations are truly justified by the scale and durability of digital business models—or presage another painful mean reversion. Investors are left balancing optimism about the future of technology with sober reminders from financial history.
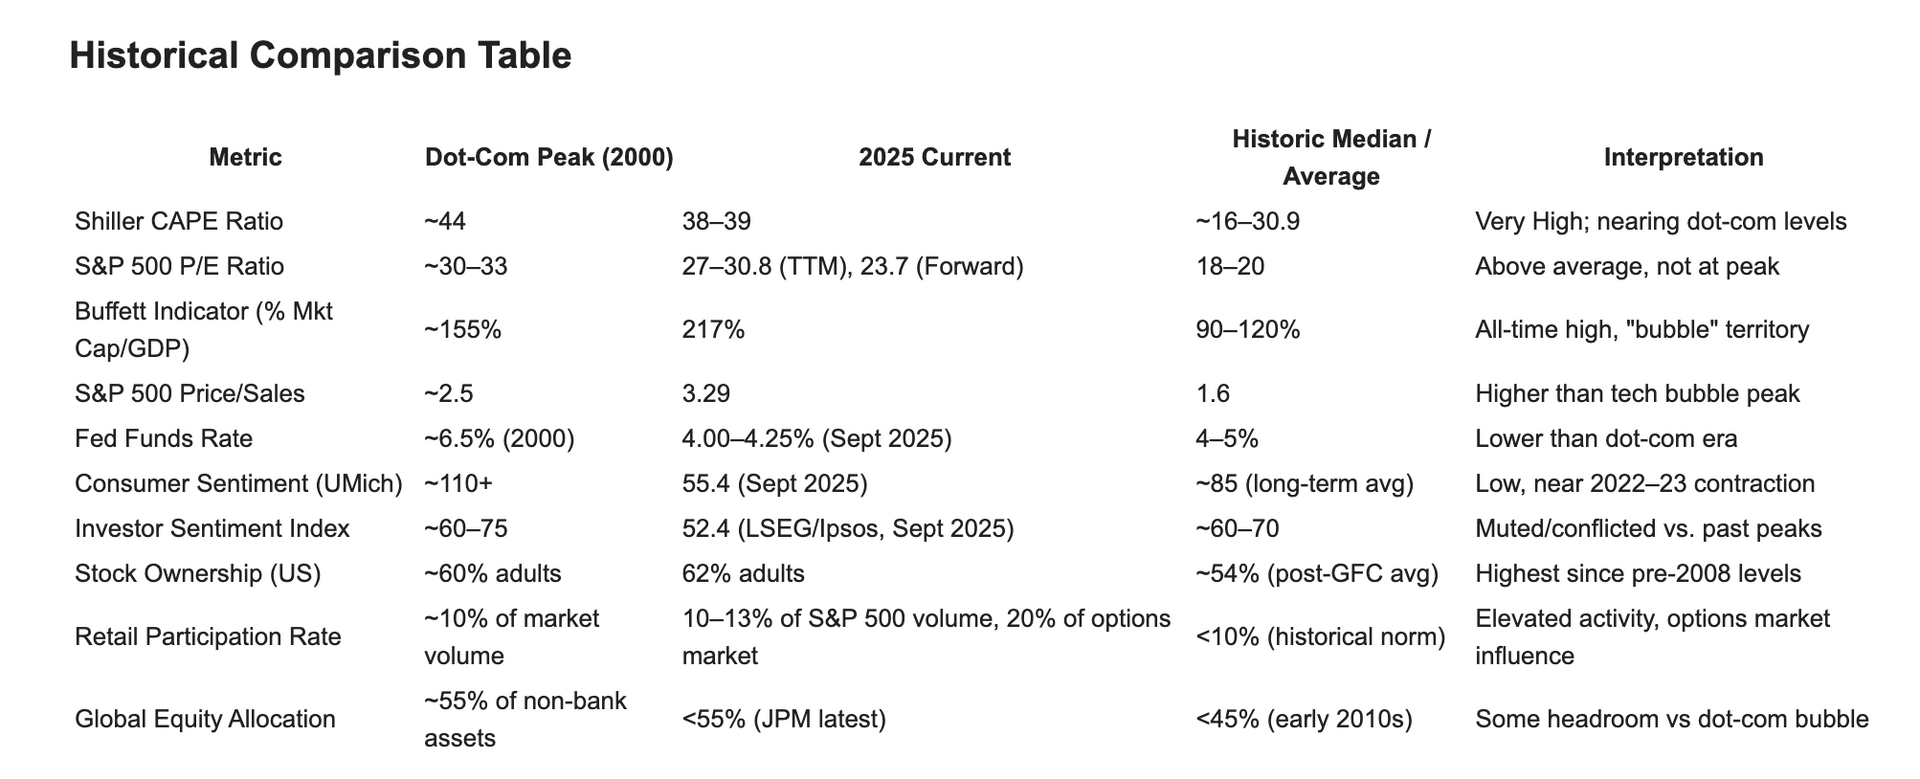
Here’s a detailed historical comparison table of the current market environment versus the dot-com bubble, including interest rates, P/E ratios, investor sentiment, and participation, using the most current data available:
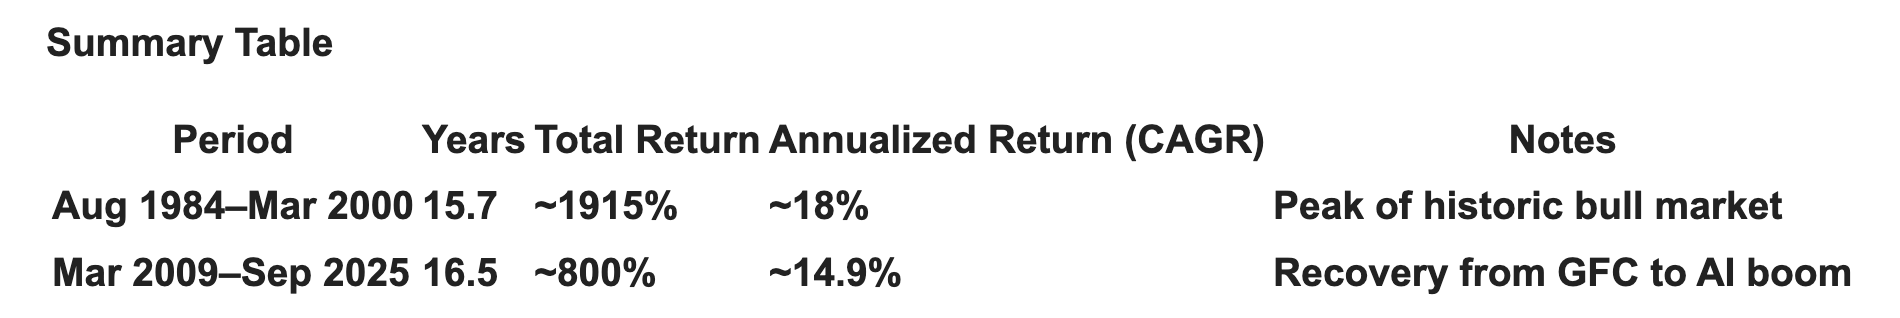
Here’s a direct comparison of the S&P 500’s total and annualized returns (including dividends) for the periods August 1984–March 2000 and March 2009–September 2025:
S&P 500: Aug 1984–Mar 2000
- Start Date: August 1, 1984
- End Date: March 24, 2000
- Period Length: ~15.7 years
Total Return (incl. dividends):
- The S&P 500 delivered a cumulative return of about 1915%.
- Annualized Total Return: ≈ 18% per year (nominal, with dividends reinvested).
S&P 500: Mar 2009–Present (Sep 2025)
- Start Date: March 9, 2009 (market bottom)
- End Date: September 18, 2025
- Period Length: ~16.5 years
Total Return (incl. dividends):
- The S&P 500 produced a cumulative return of about 800%.Annualized Total Return: ≈ 14.9% per year (nominal, with dividends reinvested).
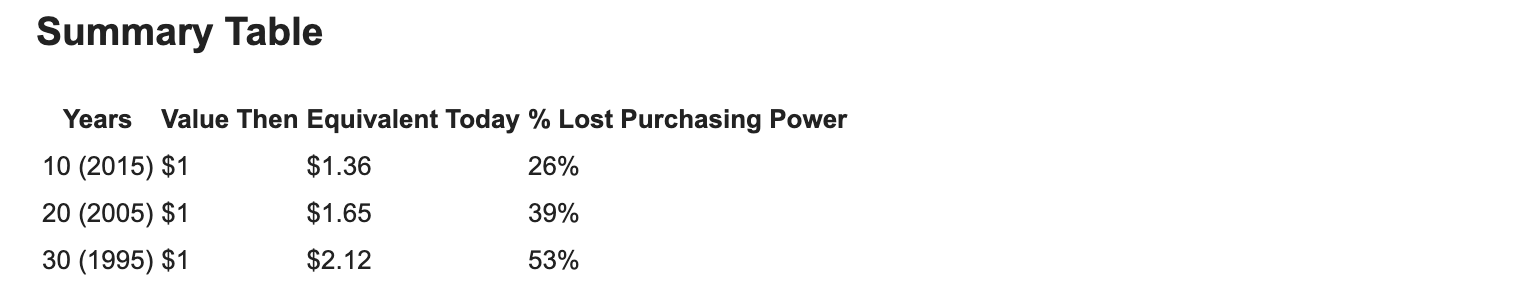
All returns consider reinvested dividends. For inflation-adjusted results, investors have realized ~8–10% annualized.
These periods rank among the best multi-year runs in market history, showing that staying invested through cycles has yielded strong long-term wealth creation—even as absolute returns from the 1984–2000 bull market remain higher than the post-2009 recovery.
Here’s a direct comparison of the NASDAQ’s total and annualized returns (including dividends) for August 1984 to March 2000 and March 2009 to September 2025:
NASDAQ: Aug 1984–Mar 2000
- Start Date: August 1, 1984
- End Date: March 24, 2000
- Period Length: ~15.7 years
Total Return (incl. dividends):
- Cumulative return: ~3750% (price return is immense due to tech expansion in the 90s; total return modestly higher with dividends, though NASDAQ dividends were low).
- Annualized Total Return: ≈ 21.6% per year.
NASDAQ: Mar 2009–Sep 2025
- Start Date: March 9, 2009 (market bottom)
- End Date: September 18, 2025
- Period Length: ~16.5 years
Total Return (incl. dividends):
- Cumulative return: ~1110%.
- Annualized Total Return: ≈ 17.8% per year (dividends included).

These figures show the extraordinary compounding power (especially of the 1984–2000 period) in the NASDAQ, as well as the long-term impact of staying invested through secular bull markets.
Notes:
- Valuations: Most current metrics (CAPE, P/S, Buffett Indicator) point to historically elevated levels, matching or surpassing dot-com extremes.
- Interest Rates: Today's rates are much lower than the dot-com era's ~6.5%, providing valuation support but risking lower future returns.
- Sentiment & Participation: Investor confidence and consumer sentiment are muted despite high market engagement; retail and options activity is at or near all-time highs, potentially amplifying volatility.
- P/E Ratios: Strong tech earnings keep P/E ratios below dot-com peaks but still well above average.
- Ownership: Retail investor participation and direct equity ownership have rebounded, aided by online access and trading platforms.
- Global Allocations: Equity allocation by institutions is below 2000 peaks, suggesting less 'all-in' risk than the dot-com bubble.
This table offers context for both bullish and bearish arguments in the current bull-bear debate, emphasizing the importance of long-term perspective and caution when navigating historically unusual market conditions.